One of the most obvious ecological patterns on Earth is the variation in species composition and diversity among geographic locations.
The study of this variation is known as biogeography. Pretend for a moment that you have a lifelong desire to see all the forest biomes on Earth. In this imaginary scenario, you have the ability to move from one geographic region on Earth to another.
Think Google Earth, but with the ability to fly down into a community and see species up close. You start in the tropics at 4°S latitude and 60°W longitude and fly into the Amazon rainforest, the most species-rich forest on Earth (TABLE 18.1). At 20 m altitude, you fly through the middle of the humid forest, and as you travel over each hectare, you see new tree species (FIGURE 18.3A). You may have encountered half of them in the previous hectare, but at least half are completely new. The more area you cover, the more tree species you see. The richness is almost overwhelming, and the heat and humidity are stifling, so you decide to head north to drier climes.
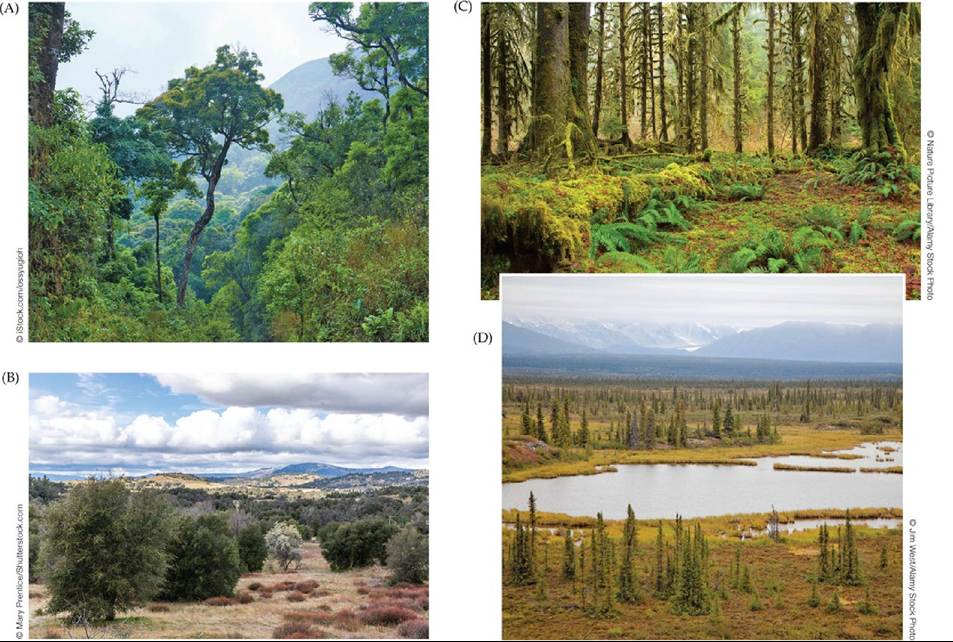
FIGURE 18.3 ForestsaroundtheWorld
Forest biomes vary greatly in their species
composition and species richness. (A) A tropical rainforest in Brazil. (B) Oak woodland in Southern California. (C) Lowland temperate evergreen forest in the Pacific Northwest. (D) Boreal spruce forest in Denali National Park, Alaska. View larger image
TABLE 18.1 Tree Species Richness in Different Forests around the World
| Forest location/type | Latitude, longitude | Approximate tree species richness | Source |
| Amazon, Brazil | 4°S, 60°W | 1,300 | Laurance 2001 |
| Southern California, USA | 35°N, 125°W | 57 | Allen et al. 2007 |
| Pacific Northwest, USA | Franklin and Dyrness 1988 | ||
| Douglas fir forest | 45°N, 123°W | 7 | |
| Garry oak forest | 45°N, 123°W | 4 | |
| Boreal forest, Canada | 64°N, 125°W | 2 | Kricher 1998 |
| New Zealand | Dawson and Lucas 2000 | ||
| Beech forest | 45°S, 170°E | 20 | |
| Flowering tree forest | 35°S, 170°E | 100 |
Sources: Laurance 2001, Allen et al 2007, Franklin and Dyrness 1988, Kricher 1998, Dawson and Lucas 2000.
You arrive at 35°N, 125°W. This is the southern coast of California, where the forests are oak woodland—a dry biome, as we learned in Chapter 3. Most of the trees and shrubs are evergreen, but they are not conifers. Instead, they are flowering plants with small, tough (sclerophyllous) leaves. The woodlands are interspersed with grasslands (FIGURE 18.3B). Flying down through the vegetation, you notice the many kinds of trees and shrubs, all with small leaves and thick bark. The woodland is aromatic because of the volatile oils contained in the shrubs and herbaceous plants. Plant species richness is high, but just a fraction of that in the Amazon (see Table 18.1).
It's still warm, so you decide to head north to 45°N, 123°W, where the forest is cool and very wet. You are in the Pacific Northwest region of North America, where the forests are dominated by large conifers.
As you fly through, you notice the lushness of the forest, with its lichen-filled canopy and fern-covered floor (FIGURE 18.3C). Tree species richness in these lowland temperate evergreen forests is a fraction of that in the two previous forests you’ve visited (see Table 18.1). There are only a handful of tree species: Douglas fir, western hemlock, western red cedar, red alder, and big leaf maple. What these forests lack in species richness, however, is made up by their huge biomass.You want to see the extremes in species richness, so your next stop is 64°N, 125°W, in the boreal forests of Canada. Flying over the cold landscape, you notice rows and rows of identical spruce trees, broken once in a while by large wetlands (FIGURE 18.3D). Dipping down into the canopy, you are struck by the dense and monotonous nature of the forest. It’s dark down under those spruce boughs, but low-lying berry bushes are a reminder that light does penetrate the canopy, especially in the summer months. You continue to fly north, and the forests thin until the landscape is one long expanse of treeless tundra.
Your trip could end here, but you have always wanted to visit New Zealand, so you take the time to fly back to the Southern Hemisphere. New Zealand was separated from the ancient continent of Gondwana roughly 80 million years ago, and since that time, evolution has produced unique forests there (FIGURE 18.4). Roughly 80% of the species in New Zealand are endemic, meaning that they occur nowhere else on Earth. Dialed into 45°S, 170°E, on the South Island of New Zealand, you fly through the Southern Hemisphere equivalent of the Pacific Northwest. Instead of conifers, the forests are dominated by four species of southern beech trees with billowy layers of twisted branches (see Figure 18.4A). Below the canopy are “divaricating shrubs,” whose multiple-angled branches give them a zigzag appearance. Plants with this growth form are found in highest abundance in New Zealand.
Although temperate evergreen forests in the Northern and Southern Hemispheres are similar in some ways (e.g., each has low tree species richness compared with forests in the tropics), they are made up of completely different species assemblages with very different evolutionary histories.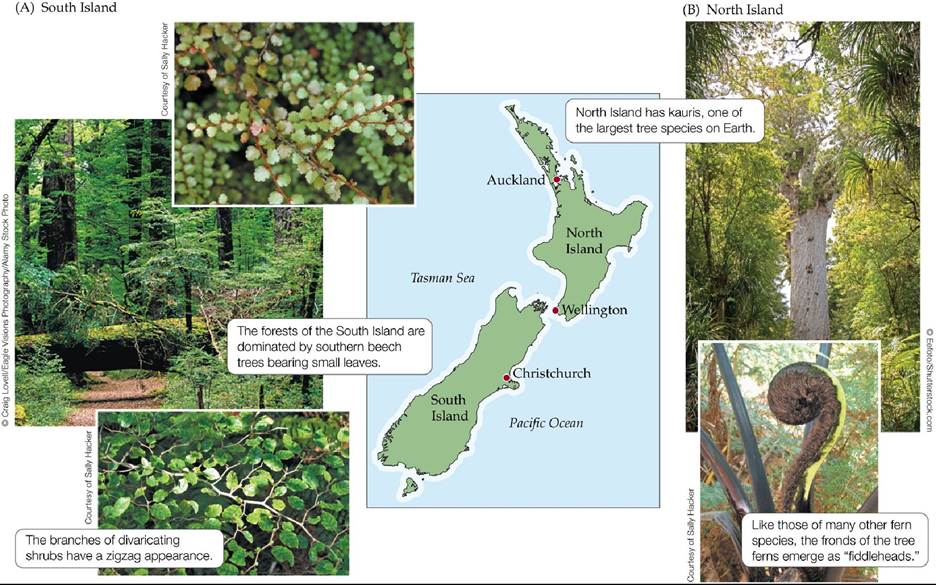
FIGURE 18.4 Forests of the North and South Islands, New Zealand Thetwoislandsof New Zealand span a large latitudinal gradient (35°S-47°S) and thus have different forest types. (A) The forests of the South Island are dominated by beeches. (B) The forests of the warmer North Island have greater tree species diversity and a different species composition than those on the South Island (see Table 18.1). View larger image
Even within New Zealand, over a distance that extends from 35°S to 47°S (a latitudinal distance identical to that from Southern California to British Columbia in the Northern Hemisphere), there are big differences in tree species richness and composition. The North Island is warmer (closer to the equator) than the South Island and has more diverse forests, consisting of many flowering tree species with a few tall emergent conifers (see Figure 18.4B). These forests have a tropical feel to them because of all the flowering trees and the multitude of vines and epiphytes (plants and lichens that live on larger plants). The tree ferns growing here are similar to those that were dominant 100 million years ago, during the age of the dinosaurs. One of the most extraordinary trees is the kauri (Agathis australis), which is among the largest tree species on Earth (interestingly, the largest is the giant sequoia, Sequoiadendron giganteum, which occurs at roughly the same latitude in the Northern Hemisphere). Some kauri trees are 60 m (200 feet) high and 7 m (23 feet) in diameter. Unfortunately, like redwoods, kauris have been extensively logged, and they exist in a forest community in only two small reserves, 100 km2 in total size.
Given that old- growth stands of kauris take 1,000-2,000 years to generate, these forests are virtually irreplaceable. If we contrast the tree species richness of the forests characteristic of the North Island with those on the South Island, we find more than 100 tree species in the warmer northern forests, compared with the 10-20 species in the less diverse beech forests characteristic of the temperate south (see Table 18.1).With our world forest tour at its end, what can we conclude about biogeographic patterns on Earth, assuming that forest communities are good global representatives?
• First, species richness and composition vary with latitude: the lower tropical latitudes have many more, and different, species than the higher temperate and polar latitudes.
• Second, species richness and composition vary from continent to continent, even where longitudes or latitudes are roughly similar.
• Third, the same community type or biome can vary in species richness and composition depending on its location on Earth.
As we will see in the rest of this chapter, these are reliable patterns that have been demonstrated over and over again for many regions of the world and many community types. What has puzzled naturalists for centuries is just what processes control these biogeographic patterns. Why are more species found in some areas than in other areas? Why do some regions harbor species assemblages that are not found anywhere else on Earth?
A number of hypotheses have been proposed to explain biogeographic variation in species diversity and composition. As we'll see, these hypotheses are highly dependent on the spatial scale at which they are applied.
More on the topic One of the most obvious ecological patterns on Earth is the variation in species composition and diversity among geographic locations.:
- CONCEPT 18.2 Global patterns of species diversity and composition are influenced by geographic area and isolation, evolutionary history, and global climate.
- Patterns of species diversity at different spatial scales are interconnected
- CONCEPT 16.2 Species diversity and species composition are important descriptors of community structure.
- CONCEPT 18.1 Patterns of species diversity and distribution vary at global, regional, and local spatial scales.
- Species distribution models can be used to predict a species' geographic range
- In the Case Study at the opening of this chapter, we saw lower hantavirus prevalence in small-mammal communities with higher species diversity than in those with lower species diversity (see Figure 19.2).
- The geographic ranges of species vary in size
- CONCEPT 19.1 Species diversity differs among communities as a consequence of regional species pools, abiotic conditions, and species interactions.
- The Largest Ecological Experiment on Earth: A Case Study
- Species composition tells us who is in the community
- The geographic ranges of species vary in patchiness
- The rate at which Earth is losing species is accelerating
- Species diversity varies with latitude
- Landscape patterns affect ecological processes
- Oceans cover 71% of Earth's surface and contain a rich diversity of life.
- Species diversity is an important measure of community structure
- CONCEPT 2.5 Seasonal and decadal climate variation are associated with changes in Earth's position relative to the sun and the strength of atmospheric pressure cells.
- CONCEPT 9.2 Species vary in their distribution and abundance across their geographic range.
- Overexploitation of species has large effects on ecological communities