In logistic growth, the population approaches an equilibrium
Some populations appear to reach a relatively stable population size, or equilibrium, that changes little over time. When this occurs, the number of individuals first increases in size, then fluctuates by a relatively small amount around what appears to be the maximum sustainable population size.
Such populations exhibit the second pattern of population growth, logistic growth. Logistic growth is a pattern in which numbers of individuals increase rapidly at first and then stabilize as the population reaches carrying capacity, or the maximum population size that can be supported indefinitely by the environment. Classic logistic growth shows an S-shaped curve (see Figure 11.13).With few exceptions, in nature, population growth does not precisely match the classic logistic growth curve shape. For example, the graph of sheep abundance in Tasmania over time (FIGURE 10.5) is roughly similar to the characteristic S- shaped logistic curve but includes more fluctuation around a carrying capacity population size.
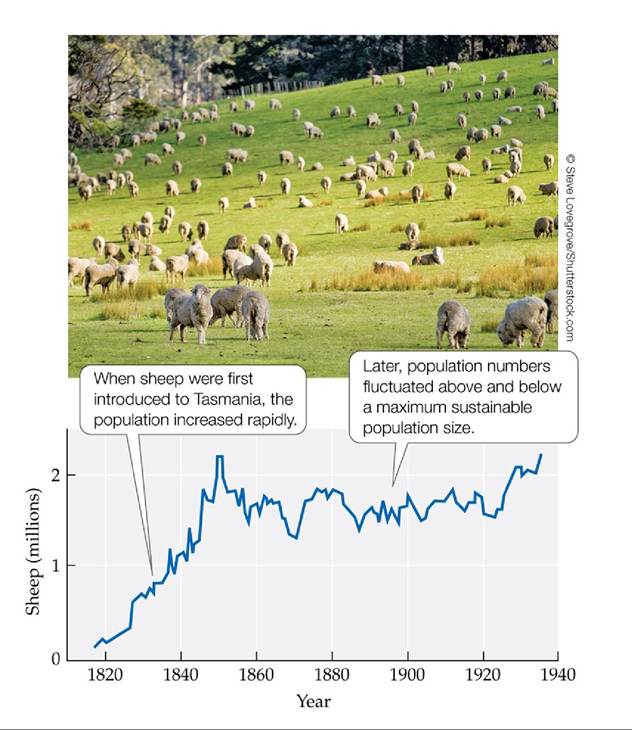
FIGURE 10.5 Logistic Growth Rises First, Then Levels Off Population growth rarely matches a classic logistic curve (see Figure 11.13). For sheep introduced to the island of Tasmania, the population increased rapidly and then leveled off with fluctuation above and below a carrying capacity or maximum sustainable population size. (After J. Davidson. 1938. Trans R Soc S Aust 62: 342-346. cc BY-NC-SA 3.0.) View larger image
More on the topic In logistic growth, the population approaches an equilibrium:
- Can logistic growth predict the carrying capacity of the U.S. population?
- The logistic equation models densitydependent population growth
- Some populations exhibit logistic growth, a pattern in which abundance increases rapidly at first and then stabilizes at a population size known as the carrying capacity, the maximum population size that canbe supported indefinitely by the environment
- CONCEPT 11.3 The logistic equation incorporates limits to growth and shows how a population may stabilize at a maximum size, the carrying capacity.
- Consequences of non-logistic resource growth
- Logistic Growth
- Patterns of Population Growth
- 11 Population Growth and Regulation
- Human Population Growth: A Case Study
- CONCEPT 11.4 Life tables show how survival and reproduction vary with age or size structure, influencing population growth and size.
- Working independently of each other, A. J. Lotka (1932) and Vito Volterra (1926) both modeled competition by modifying the logistic equation.
- NASH EQUILIBRIUM
- Equilibrium
- The equilibrium concept
- General equilibrium